한계대학 머신러닝 예측모형의 성능 비교 분석
초록
본 연구는 선행연구에서 머신러닝(Machine Learning)으로 한계대학을 예측하기 위해 개발된 모형을 확장하여 타 머신러닝 알고리즘을 적용한 예측모형의 성능과 임계치 조정을 통한 예측모형의 성능을 비교하기 위해 실시하였다. 이에 본 연구는 Random Forest, XGBoost, LightGBM 머신러닝 알고리즘을 활용하였다. 구체적으로 기본값(default setting)으로 설정된 머신러닝 모형별 예측모형의 성능을 확인하기 위해 ROC-AUC와 PR-AUC 값을 사용하였으며, 각 예측모형의 임계치 조정에 따른 최적화된 성능을 확인하기 위해 재현율(recall), 정확도(accuracy), 조화 성능(F1-score)를 활용하여 분석하였다. 연구 결과 한계대학을 예측하는데 가장 뛰어난 성능을 나타낸 것은 기본값의 경우 LightGBM이 가장 우수하였으며, 임계치 조정(informedness threshold, youden threshold, pr threshold)에 따른 최적화된 성능을 나타낸 예측모형도 LightGBM이었다.
Abstract
This study expanded the model developed in previous research to predict business crisis universities using machine learning and compared the performance of the prediction model using other machine learning algorithms with the performance of the prediction model through threshold adjustment. This study utilized Random Forest, XGBoost, and LightGBM machine learning algorithms. Specifically, ROC-AUC and PR-AUC values were used to check the performance of the prediction model for each machine learning model set to the default setting. recall, accuracy, and f1-score were used to check the optimized performance according to the threshold adjustment of each prediction model. As a result of the study, LightGBM showed the best performance in predicting business crisis universities in the case of default values. In addition, the prediction model that showed optimized performance according to threshold adjustment was LightGBM.
Keywords:
marginal universities, machine learning, random forest, XGBoost, LightGBMⅠ. 서 론
본 연구의 목적은 선행연구에서 머신러닝(Machine learning)으로 한계대학을 예측하기 위해 개발된 모형을 확장하여 타 머신러닝 알고리즘을 적용한 예측모형의 성능과 임계치 조정을 통한 예측모형의 성능을 비교 분석하는 것이다.
최근 인공지능(AI, Artificial Intelligence) 기술을 활용하여 예측모형 개발이 보편화되고 있다. 그리고 머신러닝 알고리즘은 인공지능의 하위 범주로서 데이터를 분석하는 곳에 많이 활용되고 있다. 즉, 머신러닝 알고리즘은 데이터로부터 더 많은 가치를 얻기 위해 잠재된 패턴을 발견하고 이를 예측 모형(Modeling)으로 만든다.
K. M. Kim and J.-H. Lee(2023)[1]은 대학알리미에 공시되고 있는 데이터를 바탕으로 한계대학을 예측할 수 있는 모형을 설계하였다. 그리고 머신러닝을 활용하여 한계대학 예측과 깊은 연관이 있는 항목을 찾아냄으로써 사회적 차원에서 신속한 대응책을 마련하는데 기준점을 제시하였다.
머신러닝은 데이터의 형태로 획득될 수 있는 경험(Experience)으로부터 특정한 목표작업(Task)에 대한 성능(Performance)을 개선하는 일련의 과정으로 정의할 수 있다. 선행연구는 머신러닝이 전통적인 통계학적 방법보다 한계대학을 보다 더 정확히 예측할 수 있다는 것을 보여주었으나, 예측모형에 대한 성능 개선은 아쉬운 부분이 있었다. 이에 본 연구는 한계대학 예측을 위한 머신러닝 알고리즘에 대한 성능을 비교하여 선행연구를 확장하고자 한다.
Ⅱ. 연구 방법
K. M. Kim and J.-H. Lee(2023)[1]은 랜덤 포레스트(Random Forest)를 사용하여 2012년부터 2020년까지 재정지원제한대학평가, 대학구조개혁평가, 대학기본역량진단에서 하위권 평가를 받은 대학을 대상으로 학생, 교원, 재무자료 등을 활용하여 한계대학을 예측할 수 있는 모형을 개발하였다. 연구 결과 한계대학 예측을 위해 동일한 데이터에 대해 로지스틱 회귀분석보다 Random Forest 모형을 사용하는 경우 더 정확하게 한계대학을 파악할 수 있었다고 주장하였다.
일반적으로 머신러닝을 활용한 연구는 다양한 알고리즘 활용하여 상대적 예측력이 높은 모델을 채택한다[2][3].
선행연구는 머신러닝을 통한 연구방법론에 대한 소개에 그쳤다면, 본 연구는 Naive Bayes, AdaBost, XGBost, LightGBM, Neural Network 등과 같은 다양한 머신러닝 알고리즘을 활용하여 한계대학 예측모형의 성능을 확인할 필요가 있다. 이에 본 연구는 기존의 Random Forest 뿐만 아니라 타 머신러닝 알고리즘을 적용함과 동시에 한계대학 예측모형의 임계치 조정에 따른 성능을 비교 분석하고자 한다.
본 연구의 예측모형은 성능을 비교하기 위해 Random Forest, XGBoost, LightGBM의 세 가지 머신러닝 알고리즘의 예측모형을 사용한다. 그리고 선행연구의 경우 대학과 전문대학으로 구분하였으나, 한계대학 예측을 위한 머신러닝 알고리즘의 기본 성능 확인 및 임계치 조정에 따른 최적화에서는 구분의 효익이 떨어짐으로써 통합(대학+전문)하여 분석한다. 다양한 머신러닝 알고리즘 중에서 세 가지 모형을 선택한 2가지 이유는 다음과 같다. 첫째, XGBoost와 LightGBM은 그래디언트 부스팅 알고리즘(Gradient boosting algorithm)을 기반으로 한다[4]. 그리고 그래디언트 부스팅 알고리즘은 의사결정 나무를 기반으로 만들어진 대표적인 앙상블 알고리즘이다[5]. 그래서 기존의 의사결정 나무 기반의 Random Forest로 분석한 선행연구와 일관성을 확보할 수 있기 때문이다. 둘째, 최근에는 데이터 분석 관련 전세계 최대 플랫폼인 캐글(Kaggle)에서 그 성능이 입증되어 다양한 분야에서 활용되고 있기 때문이다[6]-[8].
본 연구의 예측모형은 선행연구에서 사용한 변수를 사용하며, 예측모형은 편의상 각각 RF_model, XG_model, LGBM_model로 명명하였다.
예측모형은 한계대학을 구분하는 것이 주목적이기 때문에 한계대학을 1로 설정하고, 한계대학이 아닌 경우는 0으로 설정하였다. 예측모형의 학습과 성능 검증을 위해 한계대학 분석데이터를 학습데이터와 시험데이터의 비율은 8 : 2로 분리하였다. 2012년부터 2020년까지 분석데이터는 총 2,420행(표본 19,295개), 학습데이터는 1,936행, 시험데이터는 484행으로 구성하였다. 학습데이터와 시험데이터의 클래스 레이블 구성 비중은 동일하게 유지될 수 있도록 층화 무작위 표본 추출 방식(Stratified Random Sampling)으로 데이터를 추출하였는데, 이를 위해 python의 StratifiedShuffleSplit 라이브러리를 활용하였다. 그 결과 학습데이터와 시험데이터에서 레이블 0인 데이터는 83.9%(소수점 둘째자리에서 반올림), 레이블 1인 데이터는 16.1%(소수점 둘째자리에서 반올림)로 구성되었다. 이 과정을 그림으로 표현하면 그림 1과 같다.

Separation and composition of learning data and test data of business crisis universities analysis data
이와 같이 분리된 학습데이터를 RF_model, XG_model, LGBM_model 세 가지 머신러닝 알고리즘에 학습시켰다.
Ⅲ. 한계대학 예측모형의 성능 비교 분석
3.1 기본 설정에 따른 예측모형 성능 비교
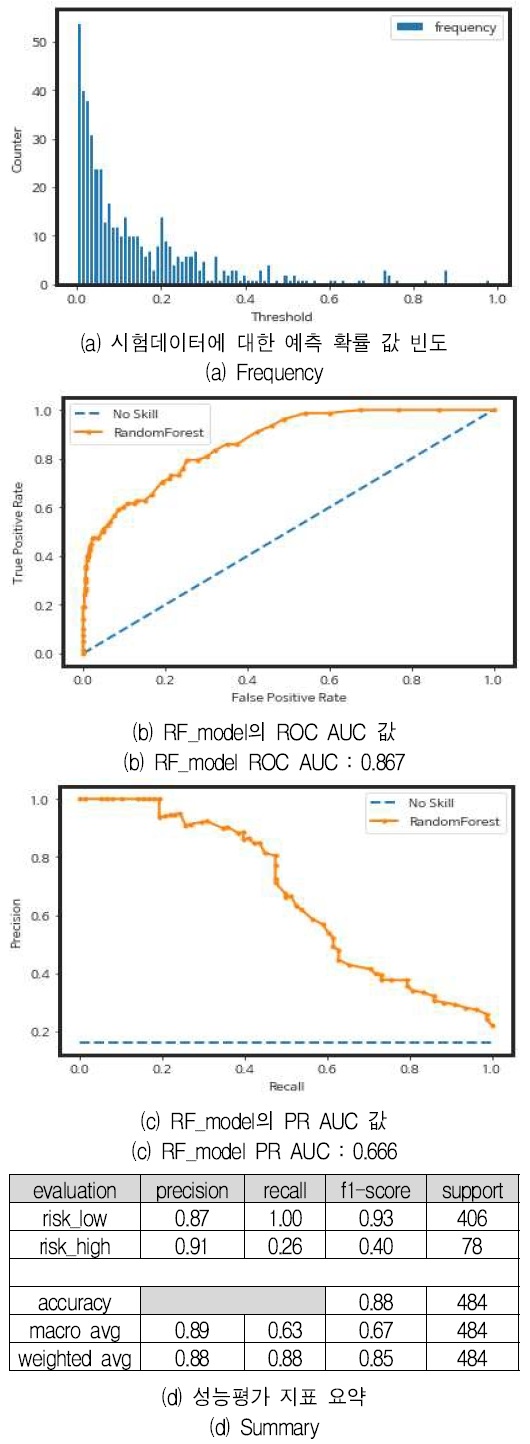
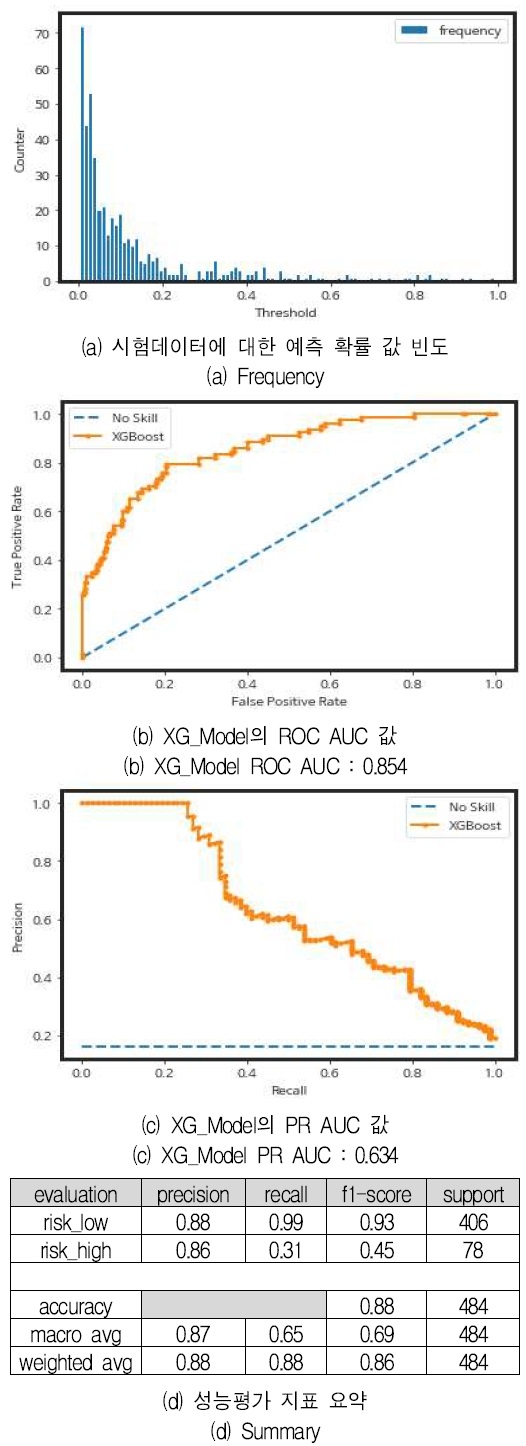
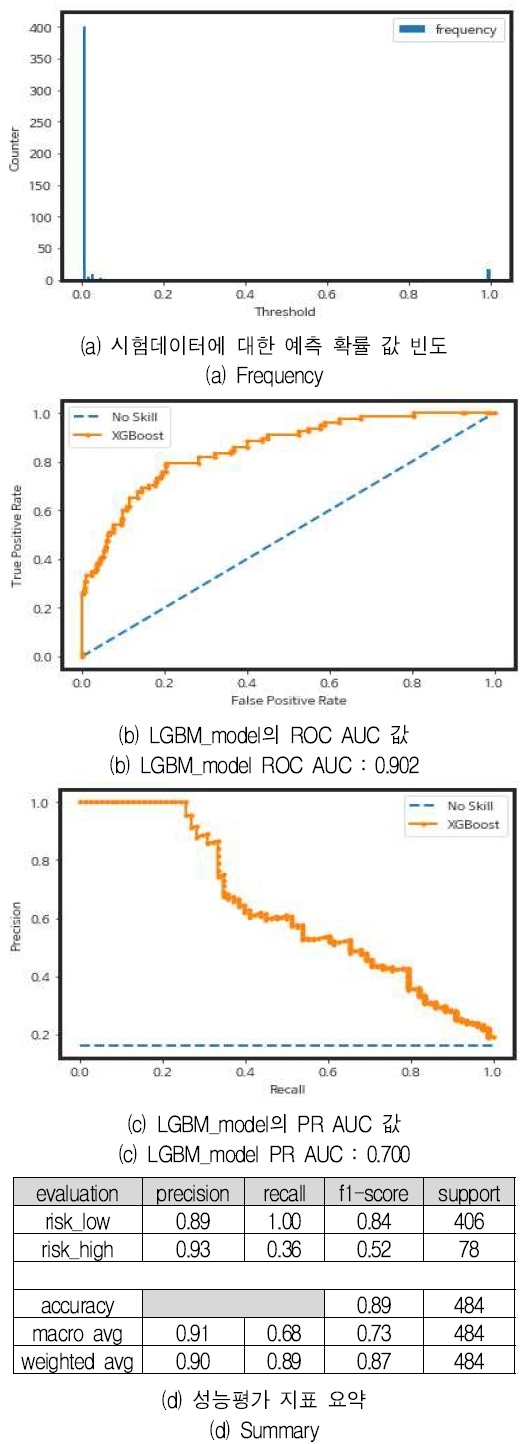
예측모형은 머신러닝 알고리즘은 기본 설정(Default setting)을 활용하였고, 예측모형별 성능의 우월성을 판단하기 위한 기준으로는 ROC-AUC와 PR-AUC 값을 활용하였다. 예측모형별 성능평가 결과는 그림 2, 그림 3, 그림 4와 같다.
각 예측모형별 머신러닝 알고리즘은 기본 설정(Default setting) 따른 성능을 정리하면 표 2과 같다.
ROC-AUC와 PR-AUC 값을 사용한 예측모형 성능의 우수성을 살펴보면 LightGBM 머신러닝 알고리즘을 활용하여 개발한 LGBM_model의 성능이 가장 우수한 것으로 나타났다.
3.2 임계치 조정에 따른 예측모형 성능 비교
예측모형의 임계치 조정이란 클래스의 레이블을 판단하기 위해 기준이 되는 예측 확률값을 조정하는 것을 말한다. 예를 들어 로지스틱 회귀 모형에서 특정 이메일이 스팸일 확률이 0.9이면 스팸 가능성이 매우 높다고 예측할 수 있다. 반대로 0.1이라면 스팸이 아닐 가능성이 높다고 할 수 있다. 그렇다면 스팸 확률이 0.6인 이메일은 어떻게 분류해야 할 것인가라는 의문점이 생긴다. 스팸일 확률이 높은 것인가? 이때 분류할 기준을 임계치(Threshold)이라고 한다. 예측모형에서 말하자면 정밀도(Precision)와 재현율(Recall)이 만나는 점이 최적의 임계치이다. 임계치를 높이면(Positive 판별 기준을 강화하면) 정밀도는 올라가고 재현율은 낮아진다. 반면, 임계치를 낮추면(Positive 판별 기준을 완화하면) 정밀도는 낮아지고 재현율은 높아진다. 이를 정밀도-재현율 트레이드 오프(Precision-Recall Trade-off)라 한다. 때문에 예측 목적에 따라 정밀도와 재현율의 중요도가 다를 수 있다. 스팸 분류는 정밀도, 암 환자 분류는 재현율을 더 중요하게 고려해야 한다.
예측모형의 성능을 측정할 때 기본 임계치는 0.5를 기준으로 되어있다. 즉, 예측 확률이 0.5 미만의 경우 한계대학이 아닌 것으로 판단하고, 0.5 이상의 경우 한계대학인 것으로 판단한다. 임계치 조정은 한계대학인지 아닌지를 판단하는 기준값인 0.5를 작거나 크게 조정하여, 예측모형의 성능을 개선하는 과정을 의미한다.
때문에 본 연구는 각 예측모형의 임계치를 조정하여 임계치의 왼쪽에 위치하는 경우 한계대학이 아닌 것으로 판단되고, 임계치의 오른쪽에 위치하는 경우 한계대학인 것으로 판단한다. 이러한 한계대학 예측모형의 임계치 조정에 따른 예측모형의 성능을 비교 분석하고자 한다.
본 연구는 클래스의 레이블 값을 판단하는 임계치 조정의 기준을 세 가지 방식으로 최적화하였다. 임계치 최적화를 위해 informedness threshold, youden threshold, pr threshold를 사용하였고, 각각의 임계치가 조정되었을 경우 성능지표를 비교해 보았다. informedness threshold와 youden threshold는 한계대학을 최대한 많이 예측하는 데 유용하며, pr threshold는 예측모형의 전반적인 실수(오탐)를 최소화하는 데 유용하다.
참고로 informedness threshold 값은 tpr(true positive rate)에서 fpr(false positive rate)을 뺀 수 중 절대값이 가장 큰 지점을 찾는 것이고, youden threshold 값은 tpr과 fpr을 합한 값에서 1을 뺀 값에 절대값을 취했을 때 가장 작은 지점을 찾는 것이다. 마지막으로 pr threshold 값은 precision에서 recall을 뺀 값에 절대값을 취했을 때 가장 작은 지점을 찾는 것이다.
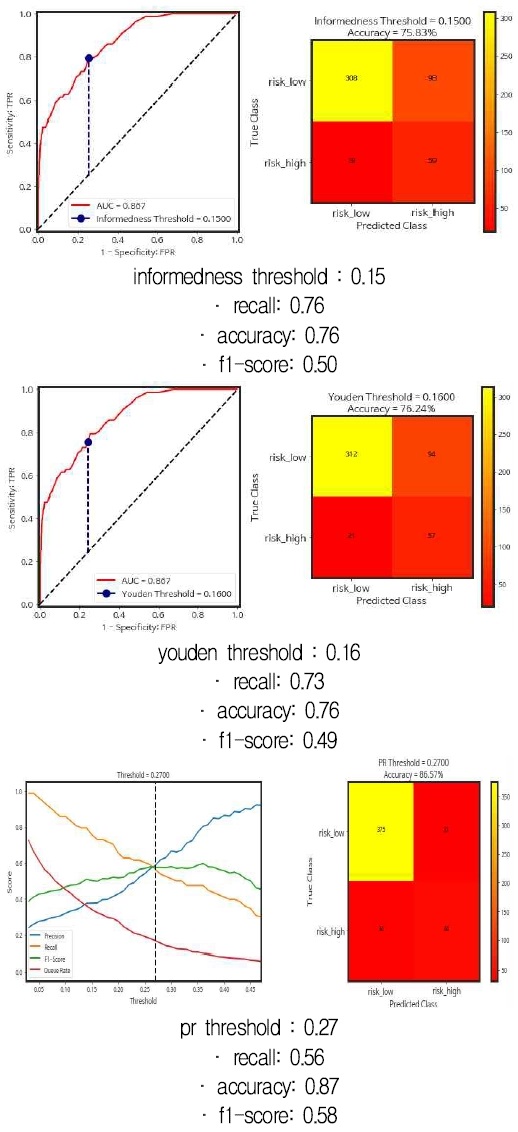
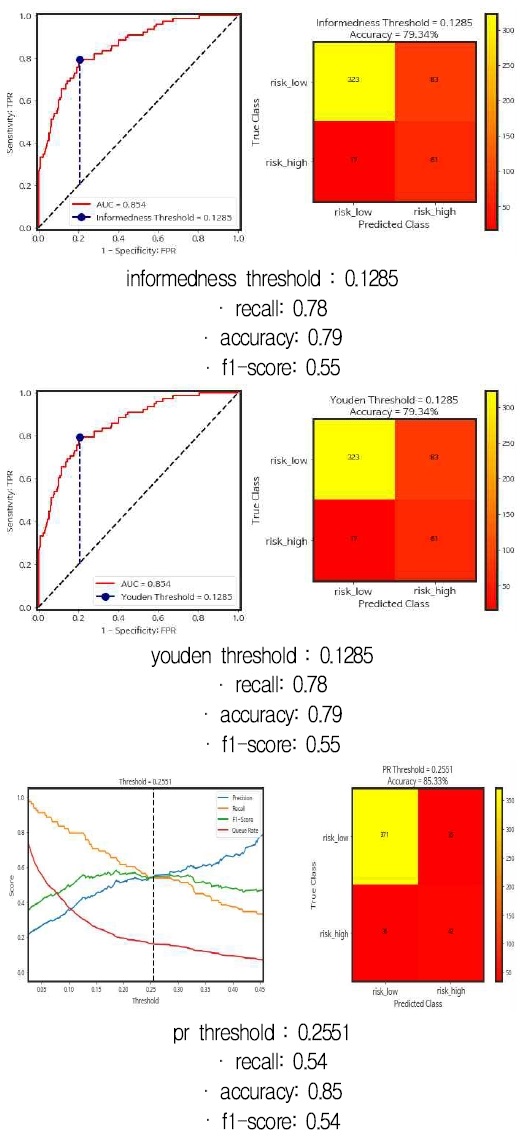
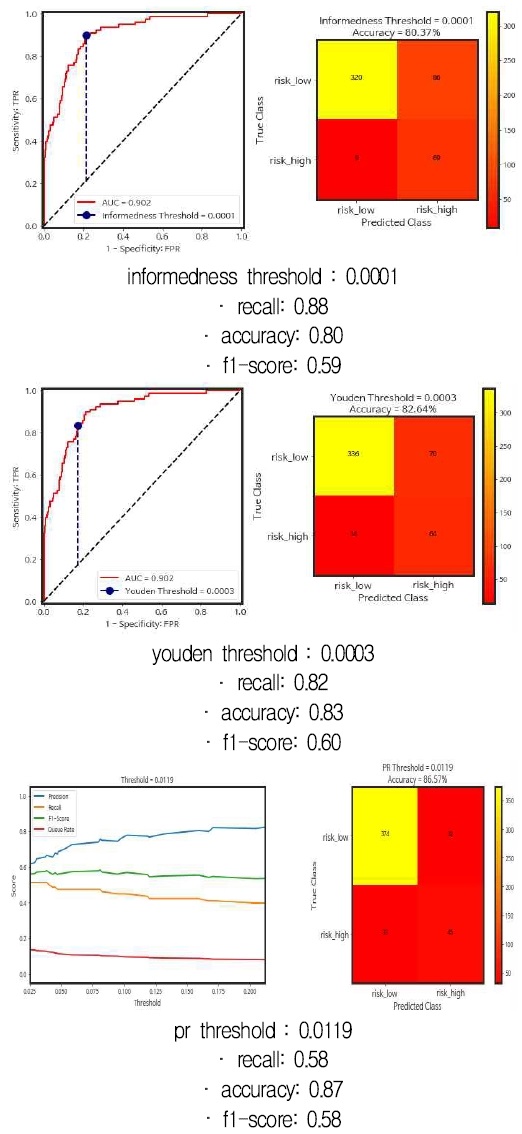
RF_model, XG_model, LGBM_model의 informedness threshold, youden threshold, pr threshold을 각각 탐색한 후 성능을 측정한 결과는 그림 5, 그림 6, 그림 7과 같다.
그림 5의 RF_model을 살펴보면 informedness threshold 최적값은 0.15였다. 즉 0.15 미만은 한계대학이 아닌 것으로 판단되어 0으로 최종 분류되고, 0.15 이상은 한계대학인 경우로 판단되어 1로 최종 분류된다. 이렇게 임계치에 따른 결과 판단 기준을 적용하면, RF_model은 재현율 0.76, 정확도 0.76의 성능을 제공하였다.
이때 youden threshold 최적값은 0.16으로 나타났으며, RF_model의 재현율는 0.73, 정확도는 0.76이었다. 그리고 pr threshold 최적값은 0.27이었다. 이때 RF_model의 재현율는 0.56이었고, 정확도는 0.87이었다. 조화 성능이라고 표현한 f1-score는 recall과 precision의 조화평균으로 계산되어 한계대학에 대한 재현율과 예측 정확율을 균형있게 표현할 수 있는 지표라고 설명할 수 있다.
그림 6의 XG_model을 살펴보면 informedness threshold 최적값은 0.1285였다. 이때 XG_model은 재현율 0.78, 정확도 0.79의 성능을 제공하였다. 또한, youden threshold 최적값도 0.1285였다.
informedness threshold와 동일한 임계치로 성능도 동일하게 밝혀졌다. 그리고 pr threshold 최적값은 0.2551이었다. 이때 XG_model의 재현율는 0.54였고, 정확도는 0.85였다.
마지막으로 그림 7의 LGBM_model을 살펴보면 informedness threshold 최적값은 0.0001이었다. 이때 LGBM_model은 재현율 0.88, 정확도 0.80의 성능을 제공하였다. youden threshold 최적값은 0.0003이었다. 재현율 0.82, 정확도 0.83의 성능을 제공하였다. 그리고 pr threshold 최적값은 0.0119였다. 이때 LGBM_model의 재현율는 0.58이었고, 정확도는 0.87이었다.
각 예측모형별 임계치에 따른 성능지표 종합적으로 정리하면 표 3과 같다. 한계대학 재현율는 LGBM_model에 informedness threshold 최적값을 적용했을 경우 0.88로 가장 높은 성능이 측정되었고, 정확도는 LGBM_model과 RF_model의 pr threshold 최적값을 적용했을 경우 0.87로 가장 높은 성능이 측정되었다. 조화 성능은 LGBM_model의 youden threshold 최적값을 적용했을 경우 0.60으로 가장 높았다.
구체적으로 표 3의 내용 중 한계대학 예측모형별 재현율는 LGBM_model에 informedness threshold 최적값이 가장 우수한 성능을 보여주었고, 다음으로 LGBM_model에 youden threshold 최적값, XG_model에 informedness와 youden threshold 최적값을 적용한 순이었다.
그리고 한계대학 예측모형별 정확도는 LGBM_model에 pr threshold 최적값을 적용한 경우와 RF_model에 pr threshold 최적값을 적용한 경우 가장 우수한 성능을 보여주었고, 다음으로 XG_model에 pr threshold 최적값을 적용한 순이었다.
또한, 한계대학 예측모형별 조화 성능은 LGBM_model에 youden threshold 최적값이 가장 우수한 성능을 보여주었고, 다음으로 LGBM_model informedness threshold 최적값, LGBM_model pr threshold 최적값을 적용한 순이었다.
표 4은 앞서 내용을 상위 3개로 순위로 종합정리한 것이다. 종합적인 성능평가 결과 한계대학 예측에 대한 재현율과 정확도, 조화 성능 모든 부문에서 균형있는 성능을 보여준 것은 LGBM_model이었다.
Ⅳ. 결 론
한계대학을 예측하기 위해 적용한 머신러닝 예측모형의 성능과 더불어 임계치 조정을 통한 예측모형의 성능을 비교하였다.
한계대학 예측모형은 머신러닝 알고리즘의 기본 설정(Default setting)을 활용한 경우 LightGBM 머신러닝 알고리즘을 활용하여 개발한 LGBM_model의 성능이 가장 우수하였다.
또한, 임계치 조정의 방식(Informedness threshold, youden threshold, pr threshold)에 따른 최적화 결과는 재현율과 정확도, 조화 성능에서 미세한 차이가 발생하였으나, 모든 부문에서 균형있는 성능을 보여준 것은 LGBM_model이었다.
본 연구는 한계대학 예측에 있어서 다양한 머신러닝의 기법을 적용하여 종합적으로 비교 분석함으로써 한계대학 예측 정확도의 향상뿐만 아니라 임계치 조정을 통한 예측모형의 최적화를 이룰 수 있음을 확인한 점에서 의의가 있다. 또한, 머신러닝 알고리즘을 활용하여 한계대학 예측모형을 개발하고 성능을 평가한 결과를 제시하여 한계대학 예측 및 분석 연구의 지평을 넓혔다는 점이다.
References
-
K. M. Kim and J.-H. Lee, "A study on exploring factors for predicting business crisis universities using machine learning : Focusing on Random Forest Model", The Journal of Economics and Finance of Education, Vol. 32, No. 1, pp. 1-30, Mar. 2023.
[https://doi.org/10.46967/jefe.2023.3.2.1.1]

-
J.-H. Lee and K.-L. Cho, "A Study on the Prediction Model for the Ratio of Mathematics Low-Performing Students in Middle School Using Machine Learning", Journal of Educational Technology, Vol. 37, No. 1, pp. 95-129, Feb. 2021.
[https://doi.org/10.17232/KSET.37.1.095]

-
J. Lee and B. Kang, "AImproving the Performance of Machine Learning-based Haze Removal Algorithm with Optimized Training Data", Journal of KIIT, Vol. 19, No. 5, pp. 87-92, May 2021.
[https://doi.org/10.14801/jkiit.2021.19.5.87]

- M. Stephen, "Machine Learning: An Algorithmic Perspective. 2/E", Chapman & Hall, pp. 390, 2015.
-
T. Chen and C. Guestrin, "XGBoost: A Scalable Tree Boosting System", Proceedings of the 22nd ACM SIGKDD International Conference on Knowledge Discovery and Data Mining, San Francisco, California, USA, pp. 785-794, Aug. 2016.
[https://doi.org/10.1145/2939672.2939785]

-
P.-j. Chun, S. Izumi, and T. Yamane, "Automatic detection method of cracks from concrete surface imagery using two-step light gradient boosting machine", Computer Aided Civil and Infrastructure Engineering, Vol. 36, No. 1, pp. 61-72, Jan. 2021.
[https://doi.org/10.1111/mice.12564]

- J.-E. Kim and S.-G. Baek, "Analysis of Issues on the College and University Structural Reform Evaluation Using Text Big Data Analytics", Asian Journal of Education, Vol. 17, No. 3, pp. 409-436, Sep. 2016.
-
H. Choi, "Comparison of Machine Learning Methods for a Prediction of Match Outcomes in Soccer", The Korean Journal of Measurement and Evaluation in Physical Education and Sport Science, Vol. 24, No. 4, pp. 81-91, Dec. 2022.
[https://doi.org/10.21797/ksme.2022.24.4.081]


2003년 2월 : 동아대학교 경영학부(경영학사)
2005년 2월 : 동아대학교 회계학과(경영학석사)
2021년 2월 : 대구대학교 회계학과(회계학박사)
2005년 1월 ~ 현재 : 한국사학진흥재단 책임행정관
관심분야 : 비영리회계, 고등교육, 인공지능, 빅데이터


