Effects of Scattering Write Request Arrivals on SSD Performance
Abstract
Intensive researches have been conducted to reduce the amount of I/O requests to NAND flash memory and to improve the performance of solid state drives (SSDs), by serving some of the I/O requests through the buffers. However, improving the performance by changing the arrival time distribution of I/O requests has not received much attention. Actually, it is possible to arbitrarily adjust the arrival time of write requests through the inside buffer. Therefore, this work evaluates the effects of the arrival time distribution of write requests on the SSD performance by varying the arrival time distribution based on actual server traces from uniformly distributed patterns to more concentrative patterns. As a result, it is found that the average response time of I/O request increases significantly as multiple write requests are generated simultaneously even if the total amount of write requests and the average inter-arrival time of write requests are similar. The founding suggests that not only the buffer hit ratio, but also when dirty buffers are flushed is an important factor affecting the performance of SSDs.
초록
스토리지의 버퍼를 활용하여 입출력 요청의 일부를 버퍼를 통해 서비스함으로써, 스토리지 내 저장 미디어에 대한 실제 입출력 요청의 양을 줄이고 스토리지의 성능을 향상하는 연구가 수행되어 왔다. 하지만 입출력 요청의 도착 시간 분포를 변화시켜서 스토리지의 성능을 향상하는 방법은 대부분의 연구에서 주목을 받지 못했다. 스토리지 내 버퍼를 활용하면 쓰기 요청의 발생 시간을 임의로 조정하는 것이 가능하다. 본 연구는 실제 서버 트레이스를 기반으로 쓰기 요청의 도착 시간 분포를 균등 분산 패턴부터 특정 시점에 집중되는 패턴까지 다양화함으로써 도착 시간 분포가 입출력 요청의 성능에 미치는 영향을 평가한다. 그 결과 쓰기 요청의 전체 양 및 쓰기 요청의 평균 도착 간격이 동일하더라도 쓰기 요청이 특정 시점에 집중되는 정도가 클수록 입출력 요청의 반응 시간이 증가함을 알 수 있었다. 이는 스토리지 내 버퍼 관리 정책에서 버퍼 적중률 뿐 아니라 더티 버퍼의 플러시 시점이 성능에 영향을 미치는 중요한 요소임을 시사한다.
Keywords:
request arrival pattern, inter-arrival time, solid state drivesⅠ. Introduction
I/O request arrival patterns and the amount of I/O requests to storage devices are mainly determined by applications that generate I/O requests and by the buffer cache or page cache manager that works above the storage devices. In general, as the amount of I/O requests is smaller and as the request arrival pattern is more scattered, an average response time of I/O requests becomes shorter. Therefore, in order to reduce the amount of I/O requests, the cache manager tries to absorb the I/O requests as much as possible by maximizing a cache hit ratio with an efficient cache replacement policy [1]-[4]. Storages also employ cache internally to service some of the I/O requests through the cache, further reducing the amount of I/O requests [3][4].
However, improving an average response time by scattering the arrival time of I/O requests has received relatively little attention. This is because the performance gain obtained by the distributed I/O requests is expected to be relatively small, compared to reducing the amount of I/O requests. In other words, it is unclear to what extent the performance will be improved if I/O requests are scattered even with the same amount of I/O requests. This study aims to analyze this issue.
Scattering read request arrivals on storage media is restricted even with the internal buffer of storage devices if applications or cache manager of a host system is not modified. For example, if a read request arrives, the request is serviced through the buffer if the request is in the internal buffer, but if not, the request is sent to the storage media. Adjusting the arrival time of the read request is restricted because if the data are not in the buffer, the request should be immediately sent to the storage medium to process it.
However, scattering write request arrivals is possible with the internal buffer. A write request to a storage medium occurs only when a dirty buffer is flushed. In the existing buffer managers, it was common that flushing a dirty buffer occurred only when the dirty buffer was evicted because scattering write requests was not considered. However, considering the dispersion of the write requests, it is also possible to flush dirty buffers in advance before they are evicted. Of course, since the flush is performed in advance, the amount of write requests may increase in some cases. However, it is possible to distribute write requests. That is, if the benefit of spreading the write requests is greater, it is advantageous to perform the flushing of the dirty buffer in advance even if the amount of the write requests increases somewhat. Therefore, we need to first understand the performance benefits of distributing write requests. In this paper, we analyze the dispersion effect of write request for solid state drives (SSDs) which are a storage device composed of multiple NAND flash chips.
The remainder of the paper proceeds as follows: Section 2 explains the internals of SSDs. Section 3 presents the performance evaluation results of distributing write requests, and Section 4 draws the conclusions.
Ⅱ. Solid state drives
SSDs use multiple NAND flash memory chips as storage media by connecting them with parallel channels. Multiple chips can be connected to one channel, and each channel can simultaneously transmit data. Each NAND chip is composed of multiple of dies, and each die is composed of multiple planes. Each plane is composed of multiple NAND blocks, and one block is composed of multiple pages. A page is the basic unit of a read/write operation. Since NAND flash memory does not support an overwrite operation, SSDs have a flash translation layer (FTL) to perform the overwrite operation by an out-of-place update method. When the out-of-place update is performed, the physical location of valid data changes on every write. Therefore, FTL manages the current physical location of each sector through a mapping table. Since the mapping table is referenced in each I/O request processing, it is common to keep the mapping table in RAM to guarantee fast access time. Therefore, most commercial SSDs have built-in large-capacity DRAM for storing the mapping table. Except for the space used to maintain the mapping table, the remaining DRAM space can be used as a buffer for NAND flash memory. This buffer can reduce the amount of I/O requests and distribute write request arrivals.
Ⅲ. Evaluation of the impact of scattering write request arrivals
In order to evaluate the effect of scattering write request arrivals on the SSD performance, we need to generate traces with different inter-arrival time (IAT) distributions with the same amount of I/O requests and the same average inter-arrival time (Avg. IAT). For this purpose, we use three server workloads downloaded from Microsoft Research Center (MSRC) (hm0, prn0, and proj0) [5] and two workloads from the Storage Performance Council (SPC) (fin1, fin2) [6] as base traces. Table 1 shows the detailed attributes of each base trace.
In each base trace, the arrival time of the read requests are not changed. Only the write request arrival times are changed as follows, and four traces (D1, D4, D16, and D64) that have different write request arrival distributions are created for each base trace. The detailed procedure of generating D1, D4, D16, and D64 is as follows. First, we calculate the Avg. IAT of write requests in each base trace. Then, in the D1 trace, a write request arrives whenever the Avg. IAT passes. In other words, D1 trace scatters write requests evenly. The sector number and the sector count to write of each write request are the same values with the base trace. Only the arrival time of the write request is changed. In the D4 trace, multiple (from one to four) write requests arrive at the same time. The number of simultaneous write requests is determined using the random function. If N write requests arrive, the next write requests arrive after (N* Avg. IAT) passes. In the same way, In the D64 trace, multiple (from one to sixty four) write requests arrive at the same time. The number of simultaneous write requests is determined using the random function. If N write requests arrive, the next write requests arrive after (N * Avg. IAT) passes. As a result, D1, D4, D16, and D64 traces all have the same Avg. IAT of write requests and the same amount of read/write requests. The difference is the write request arrival distribution. Table 2 compares the attribute values of the original hm0 traces and D1, D4, D16, and D64 traces for hm0 trace. We can know that the attribute values including the average IAT are all the same.
We used SSDSim [7] simulator which can model the parallel structure of SSD for performance evaluation. The simulator models multi-level cell (MLC) SSDs. The size of a NAND page is 4 kB, and the size of a block is 512 kB. The NAND page read, page write, and block erase latency are 500 μs, 900 μs, and 3.5 ms, respectively.
The SSD connects four chips with two parallel channels. Each chip consists of four dies, and each die has four planes. It takes 25 ns to send a byte via channel.
Meanwhile, the target chip, die, and plane of write requests are dynamically determined based on the current state of the channels and chips [7][8]. That is, the currently idle channel and the chip are chosen as target to process the write request. The target die and plane are determined in a round-robin manner. Die-interleaving and the selective multiplane policy are used to maximize internal parallelism [8]. The page mapping FTL [7][9][10] that are commonly used in SSDs is used, and the overprovision rate is set to 20%. If the clean blocks of each plane falls below 10%, a garbage collection to reclaim clean pages is performed in the background.
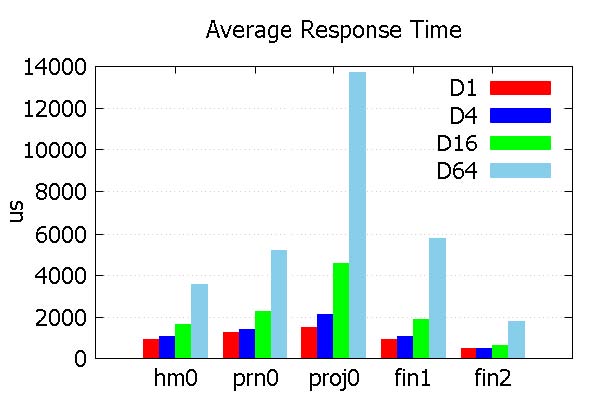
Fig. 1 shows the average response time of I/O requests. The X axis represents each base trace and the Y axis represents the average response time in μs. D1 in the legend refers to the result of the D1 trace for each base trace. D4, D16, and D64 are the same.
The results show that, the average response time is significantly increased as the number of simultaneous write requests increases. For example, The average response time of D64 is 3.7-9.1 times of D1. In particular, performance degradation is more severe in proj0 trace, where the average write request size is large as shown in Table 1. Since the average size of each request is large, the bottleneck is heavy as the write requests are concentrated. In contrast, in fin1 and fin2 traces, where the write request size is small, the performance degradation caused by the simultaneous write requests is less. It is because even if the requests are concentrated, it is possible to simultaneously process requests through the internal parallelization of SSDs such as chip striping, die-interleaving, and multiplane operations.
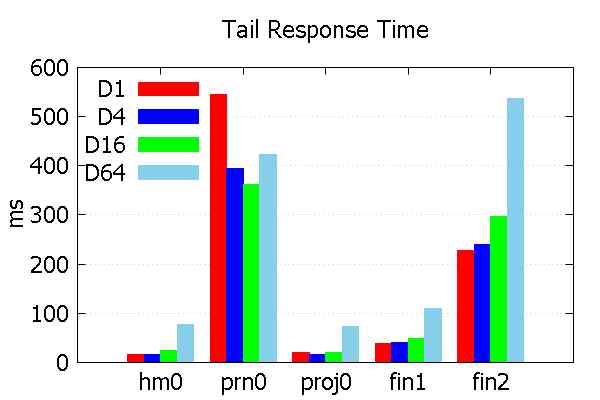
Fig. 2 shows the average response time for the lower 0.01% I/O request with long response time, which is called tail response time in this paper. The X axis represents each base trace, and the Y axis represents the tail response time in ms. The results are also similar to the results of the average response time. The tail response time of D64 is 2.4-4.8 times of D1 except in prn0, where D1 is longer than D64. That is, the tail response time is largely decreased as the write requests are concentrated.
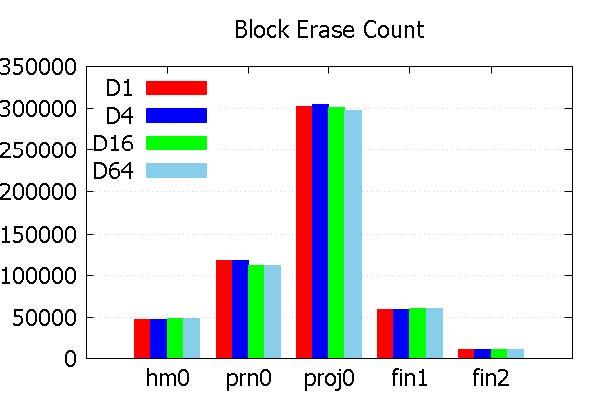
Fig. 3 shows the total count of block erasures for each trace. In D1, D4, D16, and D64, the total count of block erasures is similar because the total amount of write requests is similar. Fig. 3 assures that the number of I/O requests are similar in D1, D4, D16, and D64, even though their performance are quite different.
From the performance evaluation results, although there is no difference in the amount of I/O requests, there is a large difference in performance depending on the timely scatterings of write requests. This means that if we scatter write request arrivals through the internal buffer of SSDs, a better average response time can be delivered with a similar buffer hit ratio. The existing SSD buffer management policies mainly focus on improving the buffer hit ratio through designing an efficient buffer replacement policy. However, the results of this study suggest that it is important not only to increase the buffer hit ratio but also to scatter when dirty buffers are flushed.
Ⅳ. Conclusion
This paper evaluated the effect of the arrival time distribution of write requests on the performance of SSDs. First, even if the amount of write requests and the Avg. IAT of write requests are the same, the average response time increases significantly as the write requests are timely concentrated. Also, the performance degradation was greater when the average size of the write requests is was larger. Second, the tail response time also increased when the write requests are not scattered. Third, since the amount of write requests is similar, there is no significant difference in the number of block erasures. That is, the arrival time distribution has no significant influence on the lifetime and stability of SSDs. The evaluation results indicate that it is important not only to increase the buffer hit ratio but also to scatter write request arrivals by adjusting when dirty buffers are flushed. As a future work, we plan to design a new buffer management policy that considers scattering when dirty buffers are flushed.
Acknowledgments
This study was supported by the Research Program funded by the SeoulTech (Seoul National University of Science and Technology).
References
-
S. Park, D. Jung, J. Kang, J. Kim, and J. Lee, "CFLRU: A replacement algorithm for flash memory", International Conference of Compilers, Architecture, and Synthesis for Embedded Systems, p234-241, Oct.), (2006.
[https://doi.org/10.1145/1176760.1176789]

-
H. Jo, J. Kang, S. Park, J. Kim, and J. Lee, "FAB: Flash-aware buffer management policy for portable media players", IEEE Trans. Consumer Electron, Vol. 52(No. 2), p485-493, May), (2006.
[https://doi.org/10.1109/TCE.2006.1649669]

- H. Kim, and S. Ahn, "BPLRU: A buffer management scheme for improving random writes in flash storage", USENIX FAST Conference, Article. 16, Feb.), (2008.
-
D. Kang, S. Han, Y. Kim, and Y. Eom, "CLOCK-DNV: a write buffer algorithm for flash storage devices of consumer electronics", IEEE Trans. Consumer Electron, Vol. 63(No. 1), p85-91, Feb.), (2017.
[https://doi.org/10.1109/TCE.2017.014700]

- Microsoft Research Center, "MSRC I/O traces", ftp://ftp.research.microsoft.com/pub/austind/MSRC-io-traces.
- Storage Performance, "SPC I/O traces", http://traces.cs.umass.edu/index.php/Storage/Storage [accessed: Jan. 07, 2018].
-
Y. Hu, H. Jiang, D. Feng, L. Tian, H. Luo, and S. Zhang, "Performance impact and interplay of SSD parallelism through advanced commands, allocation strategy and data granularity", Proc. 25th ACM International Conf. on Supercomputing, Tucson, Arizona, p96-107, May), (2011.
[https://doi.org/10.1145/1995896.1995912]

-
I. Shin, "Improving internal parallelism of solid state drives with selective multi-plane operation", Electronics Letters, Vol. 54(No. 2), p64-66, Jan.), (2018.
[https://doi.org/10.1049/el.2017.3912]

- A. Ban, "Flash file system", United States Patent. No. 5,404,485, Apr.), (1995.
- D. Yoo, and I. Shin, "Implementing Greedy Replacement Scheme using Multiple List for Page Mapping Scheme", Journal of KIIT, Vol. 9(No. 6), p17-23, Jun.), (2011.

2005 : PhD degree in Department of Computer Engineering, SNU.
2008 ~ current : Professor in Department of Electornic Engineering, SeoulTech.
Research interests : storage system, embedded system, operating system


